


SELECTED FINANCIAL DATA
| in PLN thousand | in EURO thousand | |||
| Basic figures from separate statement of comprehensive income | For the year ended 31 December 2017 |
For the year ended 31 December 2016 |
For the year ended 31 December 2017 |
For the year ended 31 December 2016 |
| 1. Revenue from sales | 1 014 796 | 1 027 157 | 239 074 | 234 741 |
| 2. Cost of sales | (816 873) | (837 815) | (184 646) | (191 470) |
| 3. Revenue/(costs) of compensation for stranded costs | (27 180) | 4 531 | (6 212) | 1 035 |
| 4. Operating profit | 165 114 | 190 567 | 38 899 | 43 551 |
| 5. Profit before tax | 164 544 | 186 241 | 38 765 | 42 563 |
| 6. Net profit | 132 275 | 150 940 | 31 162 | 34 495 |
| 7. Net profit for the period attributable to ordinary shareholders | 131 225 | 149 620 | 30 915 | 34 193 |
| 8. Net profit for the period attributable to non- controlling interests | 1 050 | 1 320 | 247 | 302 |
| 9. Basic earnings per share (in PLN/EUR) | 8,81 | 10,04 | 2,07 | 2,29 |
| 10. Other comprehensive income, net of tax | (124) | (73) | (29) | (17) |
| 11. Total comprehensive income | 132 151 | 150 867 | 31 133 | 34 478 |
| Basic figures from consolidated statement of cash flows | ||||
| 12. Net cash flow from operating activities | 330 694 | 429 495 | 77 908 | 98 155 |
| 13. Net cash flow from investing activities | (77 361) | (162 727) | (18 225) | (37 189) |
| 14. Net cash flow from financing activities | (117 449) | (181 963) | (27 670) | (41 585) |
| Basic figures from consolidated statement of financial position | As at 31 December 2017 |
As at 31 December 2016 |
As at 31 December 2017 |
As at 31 December 2016 |
| 15. Non-current assets | 1 725 453 | 1 776 003 | 413 688 | 401 447 |
| 16. Current assets | 600 237 | 470 124 | 143 911 | 106 267 |
| 17. Total assets | 2 325 690 | 2 246 127 | 557 599 | 507 714 |
| 18. Non-current liabilities | 558 187 | 508 476 | 133 829 | 114 936 |
| 19. Current liabilities | 261 092 | 264 778 | 62 598 | 59 850 |
| 20. Equity attributable to ordinary shareholders | 1 502 239 | 1 469 180 | 360 172 | 332 093 |
| 21. Equity attributable to non- controlling interests | 4 172 | 3 693 | 1 000 | 835 |
| 22. Equity | 1 506 411 | 1 472 873 | 361 172 | 332 928 |
| 23. Number of shares (in thousands) | 14 900 | 14 900 | 14 900 | 14 900 |
| 24. Book value and diluted book value per share (in PLN/EUR) | 101,10 | 98,85 | 24,24 | 22,34 |
Exchange rates of euro used for translation of selected financial data
- Statement of financial position items - average exchange rate announced by NBP as at 31 December 2017 4.1709
- Statement of comprehensive income and cash flows items - arithmetic average of average exchange rates announced by NBP as at the end of each mont of the period from 1 January to 31 December 2017 4.2447
- Statement of financial position items - average exchange rate announced by NBP as at 31 December 2016 4.4240
- Statement of comprehensive income and cash flows items - arithmetic average of average exchange rates announced by NBP as at the end of each mont of the period from 1 January to 31 December 2016 4.3757

RATIOS, CAPITAL GROUP
| (%) | from 1 January to 31 December 2017 | from 1 January to 31 December 2016 | Change (%) |
| Return on assets (ROA) | 5,68 | 6,72 | (15) |
| Return on equity (ROE) | 8,77 | 10,24 | (14) |
| Return on capital employed (ROCE) | 10,61 | 13,24 | (20) |
ANALYSIS OF CONSOLIDATED FINANCIAL STATEMENT
Consolidated financial statement of Capital Group KOGENERACJA S.A. in 2017 [in MPLN]
![Consolidated financial statement of Capital Group KOGENERACJA S.A. in 2017 [in MPLN]](/source/img/wykresy/xgk_en.jpg.pagespeed.ic.Z80vNd1Tzw.jpg)
- KOGENERACJA S.A.
- EC ZIELONA GÓRA
- Intragroup transactions
- Capital Group
Elimination of intragroup transactions (IG) on the amount mainly refers to the dividend payment by EC Zielona Góra S.A. (-32.7 MPLN) and other intragroup transactions.
ANALYSIS OF CONSOLIDATED NET PROFIT 2017 VS. 2016
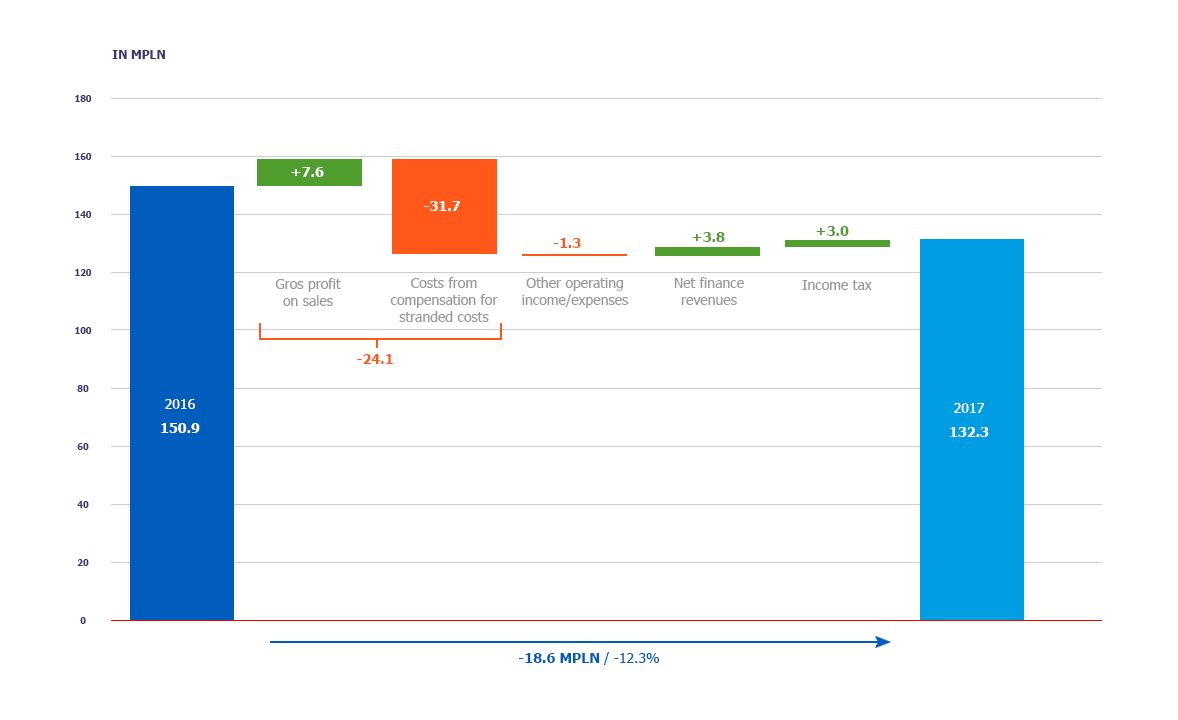
Lower net profit as compared to 2017 by 18.6 MPLN (-12.3%), mainly due to the following::
- +7.6 MPLN - increase in profit on sales due to higher sales of electricity in EC ZG and higher sales of heat in both units while lower prices of electricity
- -31.7 MPLN - methodology of the LTC compensation change
- -1.3 MPLN - lower other operating income, including:
- -2.9 MPLN increase in provisions for landfill reclamation
- +3.6 MPLN net result of raised and released impairment charges
- +2.0 MPLN assets sales, R2 switching station
- -0.5 MPLN lower income from subsidies
- -0.9 MPLN other
- +3.8 MPLN - higher net finance revenues: higher finance income +3.1 MPLN; reduced finance costs + 0.7 MPLN, i.e.:
- +1.6 MPLN higher financial revenues (interests of cash-pool)
- +1.4 MPLN interests on leasing
- +1.9 MPLN lower discount on stranded costs
- -1.1 MPLN financial instruments value update
- +0.3 MPLN - higher income tax
CONSOLIDATED REVENUES
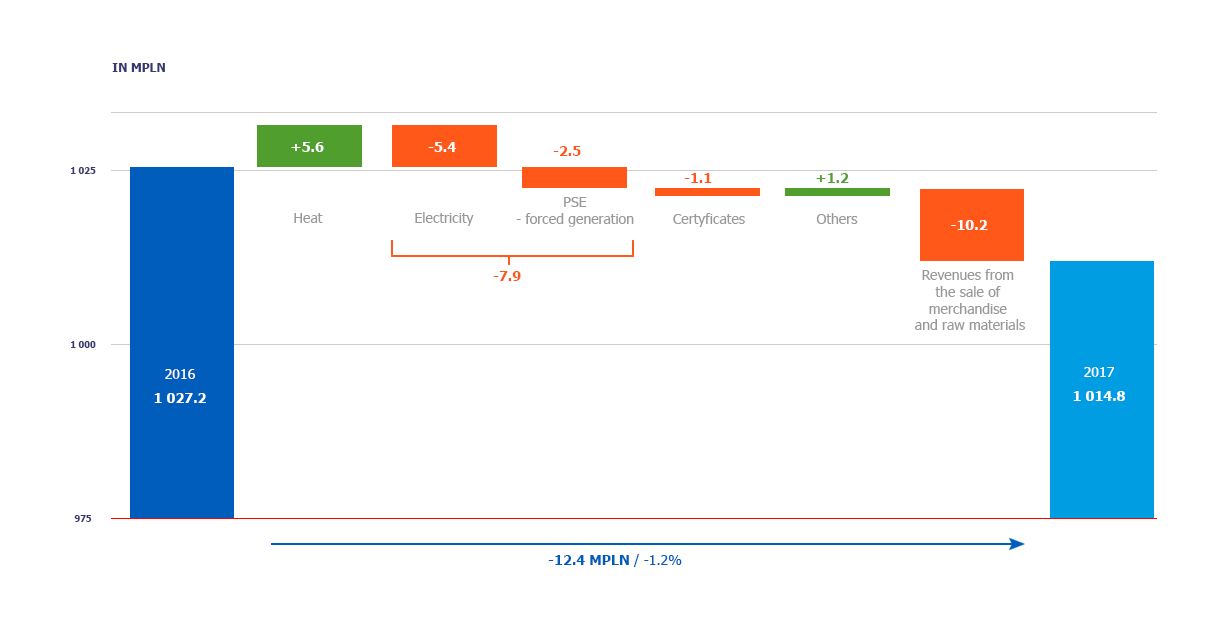
Lower revenue from sales as compared to 2016 by 12.4 MPLN (-1.2%), mainly due to the following:
- -7.9 MPLN - higher revenues on electricity sales, including:
- +4.0 MPLN higher electricity sales in EC Zielona Góra S.A. by 2%,
- -11.9 MPLN lower revenues form electricity sales in the Parent Company KOGENERACJA S.A. (-9,4 MPLN lower revenues from electricity sales (lower sales volume by 1,7%, lower electricity sales prices by ca. 5,5%), -2,5 MPLN – lower revenues from electricity sales to PSE)
- +5.6 MPLN - higher revenues on heat sales: +4.7 MPLN in KOGENERACJA S.A., +0.9 MPLN in EC Zielona Góra S.A.
Volume: 1.5% increase in KOGENERACJA S.A., 0.7% increase in EC Zielona Góra S.A. Price: positive effect from average heat prices
- -1.1 MPLN - higher revenues on sales of certificates: +6.6 MPLN higher revenues on sales of yellow certificates in EC Zielona Góra S.A. and -7.7 MPLN lower revenues on sales of certificates in KOGENERACJA S.A. (lower certificates prices)
- +1.2 MPLN - higher other revenues from sales
- -10.2 MPLN - lower revenues from the sale of merchandise – lower resale of electricity by EC Zielona Góra S.A.
CONSOLIDATED FIXED COSTS AND VARIABLE COSTS ANALYSIS
FIXED COSTS
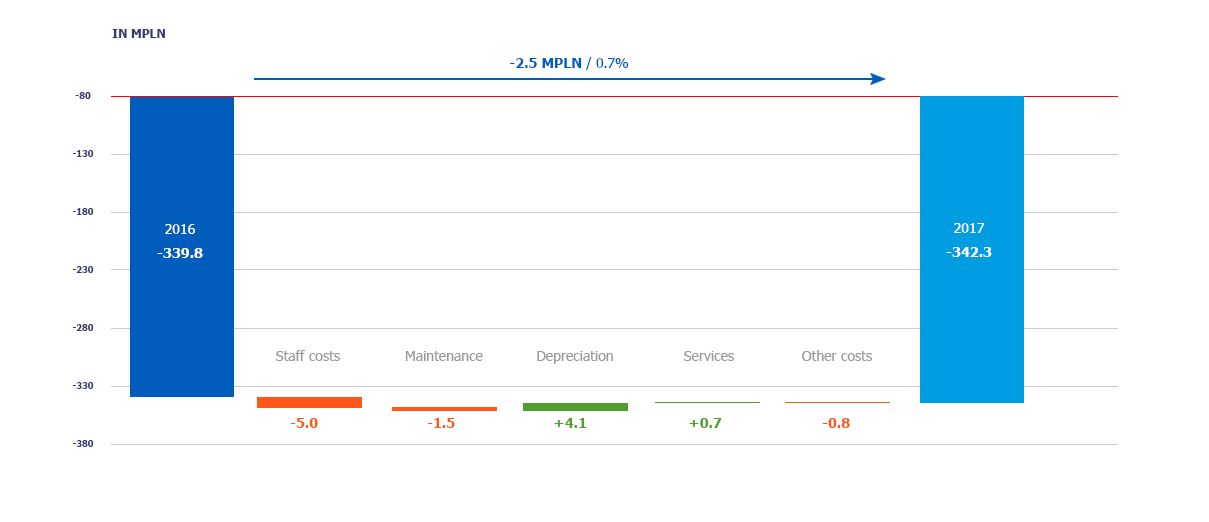
Lower fixed costs as compared to 2016 by 2.5 MPLN (0.7%).
Staff costs increased by 5.0 MPLN, i.e.:
- +6.8 MPLN higher staff costs in KOGENERACJA S.A.;
- -1,8 MPLN lower costs in EC Zielona Góra S.A.
Maintenance costs increased by 1.5 MPLN - increase in Parent Company KOGENERACJA S.A. by 1.4 MPLN, increase in EC Zielona Góra S.A. by 0.1 MPLN.
Depreciation decreased by 4.1 MPLN i.e.:
- lower depreciation costs by 6.0 MPLN in Parent Company KOGENERACJA due to fixed assets lifetime change and production-related facilities lifetime adjustment and -1.9 MPLN increase in EC Zielona Góra S.A.
Cost of services decreased by 0.7 MPLN, what counterbalanced the increase of other fixed costs by 0.8 MPLN.
VARIABLE COSTS
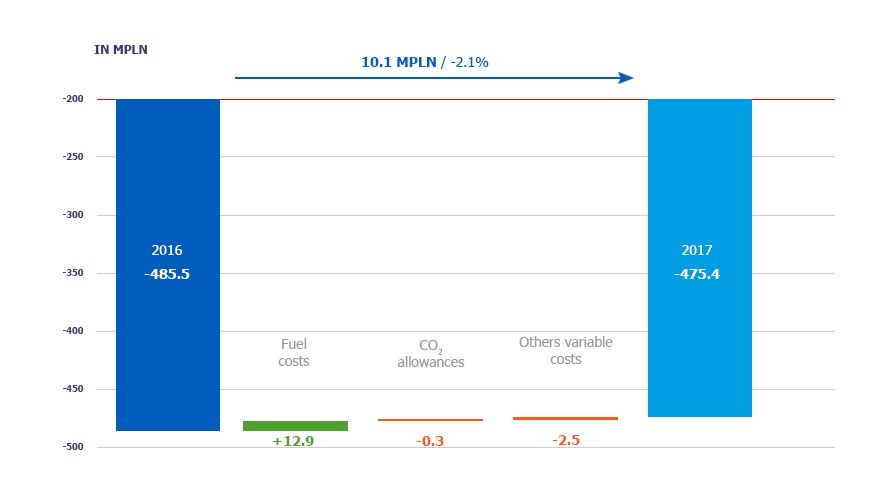
Lower variable costs as compared to 2016 by 10.1 MPLN (2.1%).
Costs related to the shortage and purchase of CO2 allowances increased by 0.3 MPLN (-2.8 MPLN in KOGENERACJA S.A., +2.5 MPLN in EC Zielona Góra S.A.) as an effect of lower limits of free CO2 allowances and the lower cost of purchase of CO2 allowances.
Fuel costs decreased by 23.9 MPLN, i.e.:
+15,7 MPLN - lower costs of coal purchase:
- -0,3 MPLN slightly higher volume of coal consumption (in 2017: 16 334 TJ, in 2016: 16 319 TJ),
- +16,0 MPLN lower coal price,
+8,0 MPLN - lower costs of biomass consumption:
- +6,3 MPLN lower volume of biomass consumption (in 2017: 696 TJ, in 2016: 966 TJ),
- +1,7 MPLN lower biomass price
In EC Zielona Góra S.A. fuel costs increased by 11.0 MPLN due to higher volume of gas consumption (by 5%) and higher gas price.
Other variable costs increased by 2.5 MPLN, due to electricity market activity.
CONSOLIDATED STATEMENT OF CASH FLOWS ANALYSIS


